Trend Charts
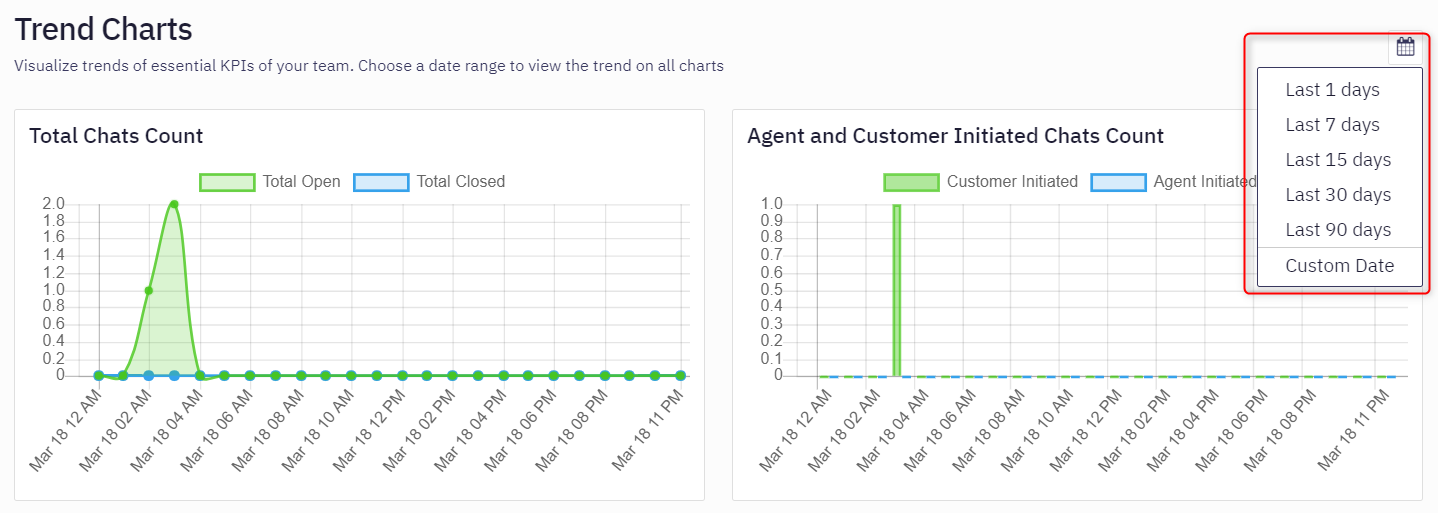
This sub-module provides a graphical representation of the current trends related to chats, agents, and customers on the Chat Console. Team managers and analysts can view a graphical report for the last 1 day, last 7 days, last 15 days, last 30 days, last 90 days, and user-specified custom date range. Apart from this, they can also view a customized graphical report based on the business need.
To navigate to trend chats,
- Navigate to Customer Care Console > Reports.
- Click Trends Charts to visualize historical data.
The following graphical reports are displayed on this page:
- Total Chats Count
- Agent and Customer Initiated Chats Count
- Total Number of Chats per Channel
- Average Response Time
- Count of Messages Sent
- Count of Messages Received
- Top Tags Used
- Average Login Time
To view the reports,
- Select a date range from the top-right corner of the Trends Charts page. The current date reports will be displayed by default.
- Mouse hover on the data nodes of a chart to view the numerical data.
- The date range selected is applicable to all the charts on the page.
Note
Follow the above procedure to generate the graphical report for all the sections.
Total Chats Count
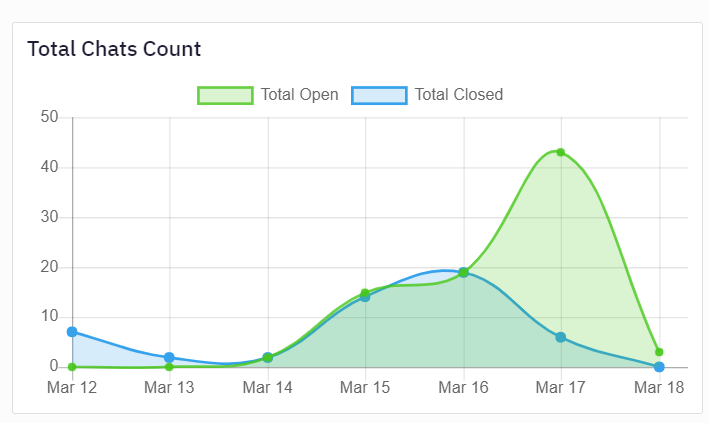
This graph represents the total number of chats, both created and closed, on the chat console for the selected time period.
Sample: Total chats created and closed for last 7 days.
Agent and Customer Initiated Chat Count
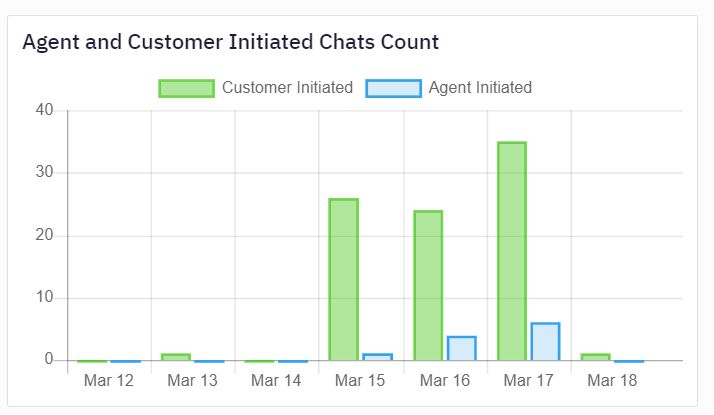
This graph represents the number of chats initiated by the customers and the agents for the selected time period.
Sample: Chats initiated by agents and customers in the last 7 days.
Total Number of Chats per Channel
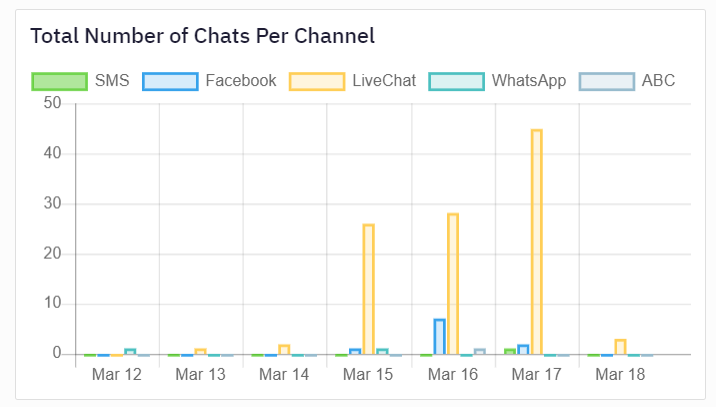
This graph represents the number of chats recorded for each channel and for the selected time period. Click the channel on the legend to Turn ON and OFF the channel from the graph.
Sample: Chats recorded for each channel in the last 7 days.
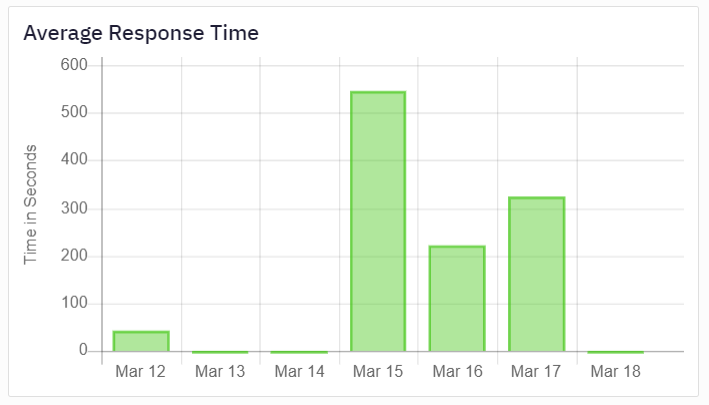
Average Response Time
This graph represents the average response time calculated on the Chat Console for the selected time period.
Sample: Average response time in the last 7 days.
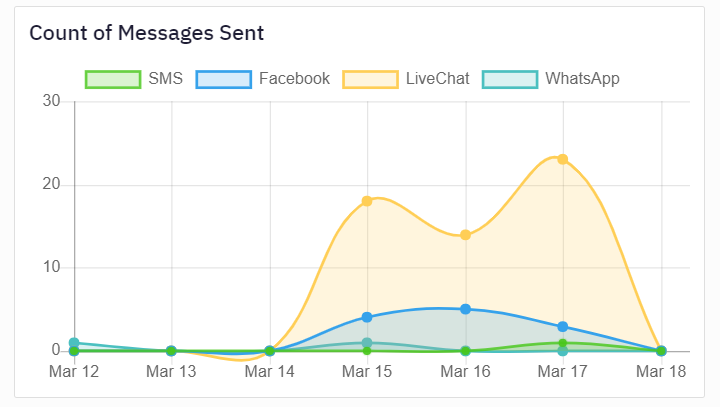
Count of Messages Sent
This graph represents the total number of messages sent through each channel for the selected time period.
Sample: Total messages sent out in the last 7 days.
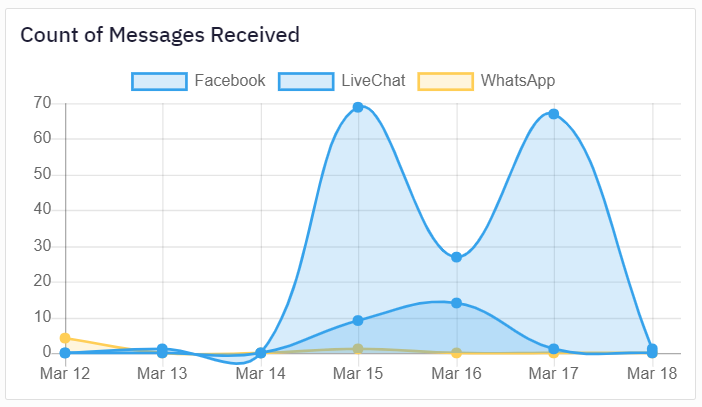
Count of Messages Received
This graph represents the total number of messages received through each channel for the selected time period.
Sample: Total messages received through in the last 7 days.
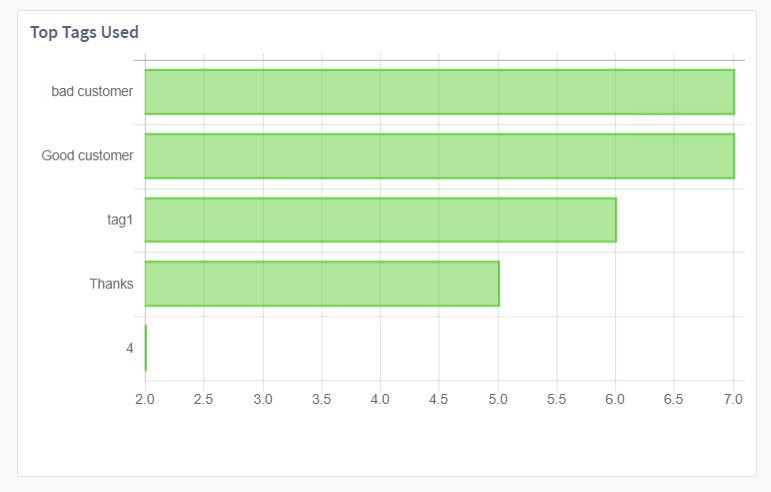
Top Tags Used
This graph represents five most frequently used tags in the Chat Console for the selected time period.
Sample: Top five tags in the last 7 days.
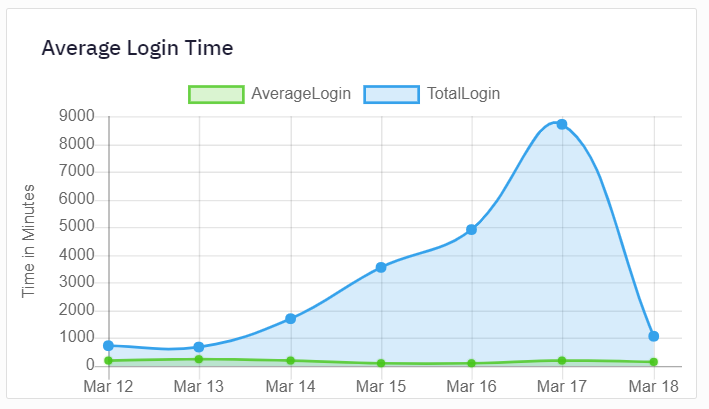
Average Login Time
This graph represents the total and average login time of the agents on the Chat Console for the selected time period.
Sample: Total and Average Login time in the last 7 days.
Updated about 3 years ago
