
Dashboard
As a client admin, when you launch the React application from the Webex Engage Client admin console (Try new version), you will navigate to the Dashboard screen on the React application. Here, you can monitor your team's performance to boost productivity. You can track the activity of logged-in agents within a team and have an opportunity to have direct insight into a chat that an agent within the same team currently holds. You can view the conversations awaiting the agent's reply on the Dashboard screen. Thus, you will have visibility of any waiting customers within the team.
To view the teams' performance, you must select the list of teams from the Teams drop-down on the top-right corner of the Dashboard screen.
The dashboard is categorized into the following interactive cards:
- Conversations
- Workforce

Conversations
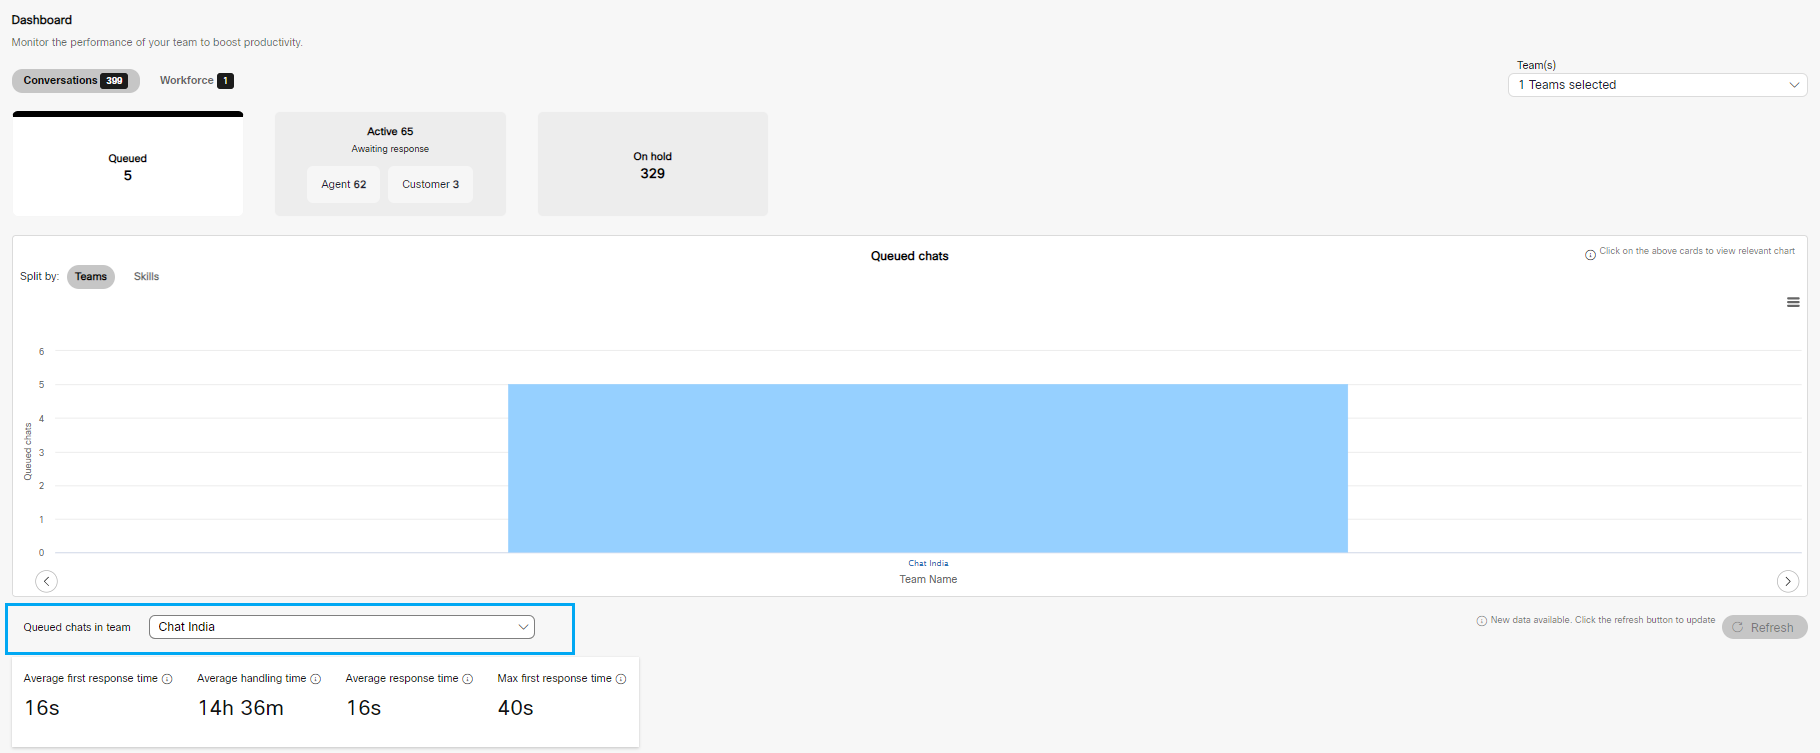
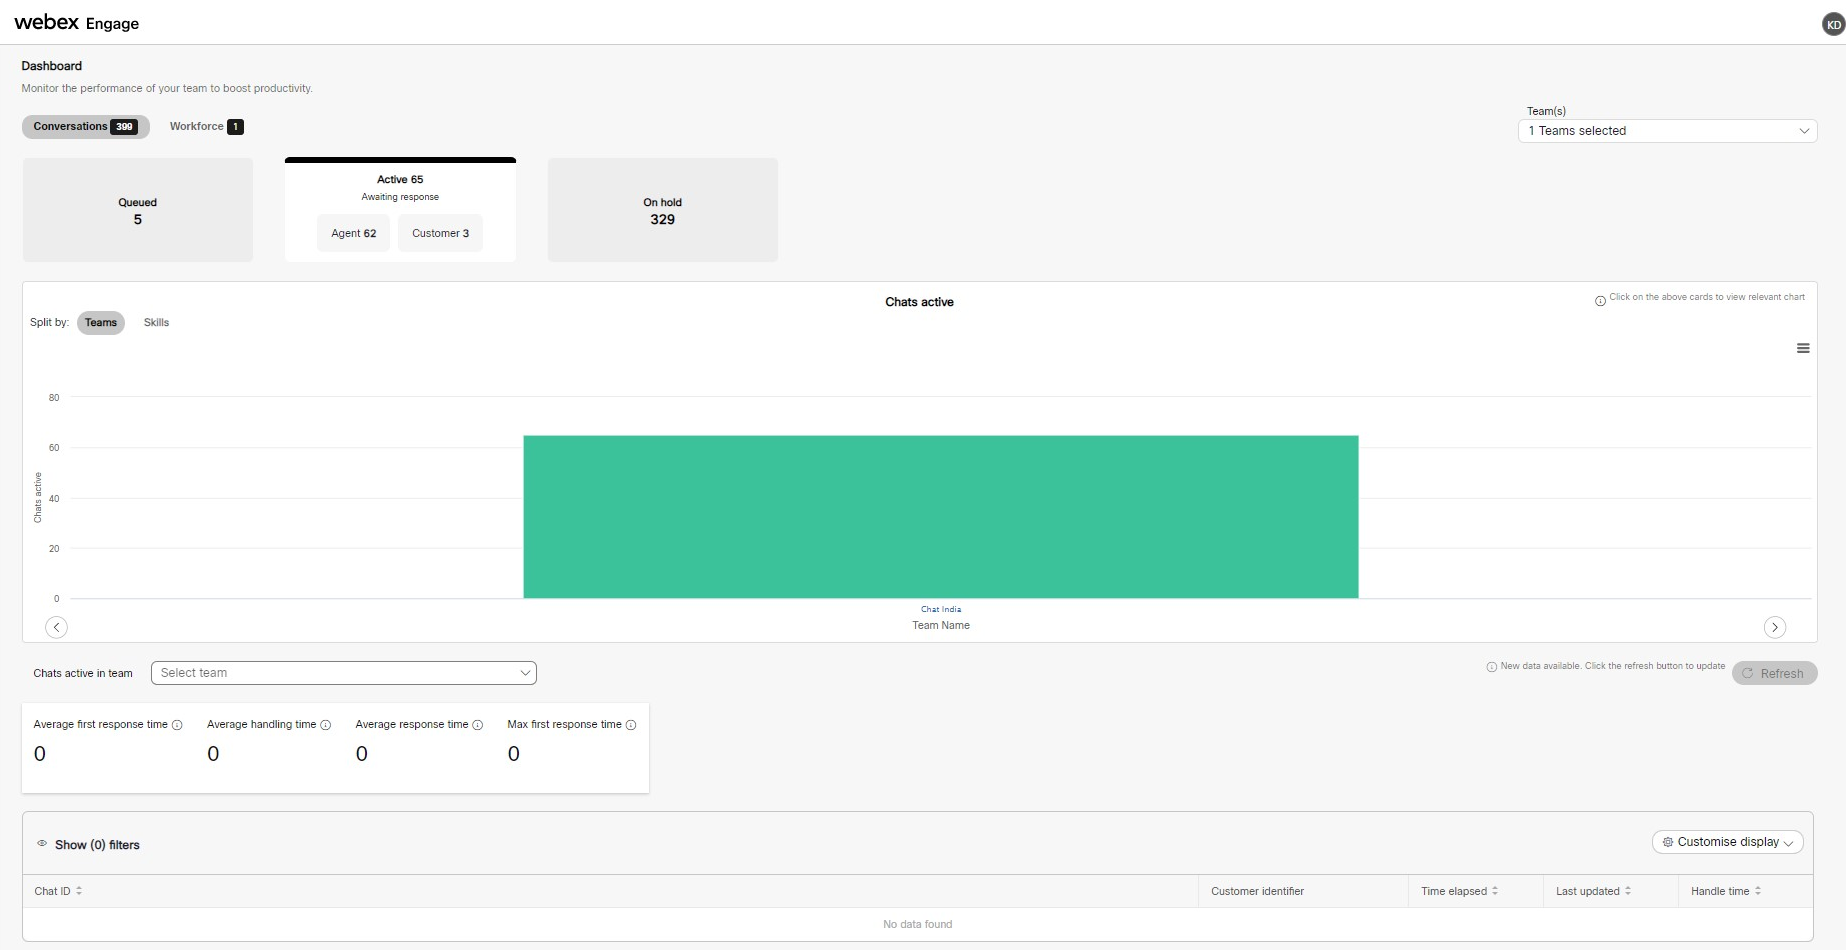
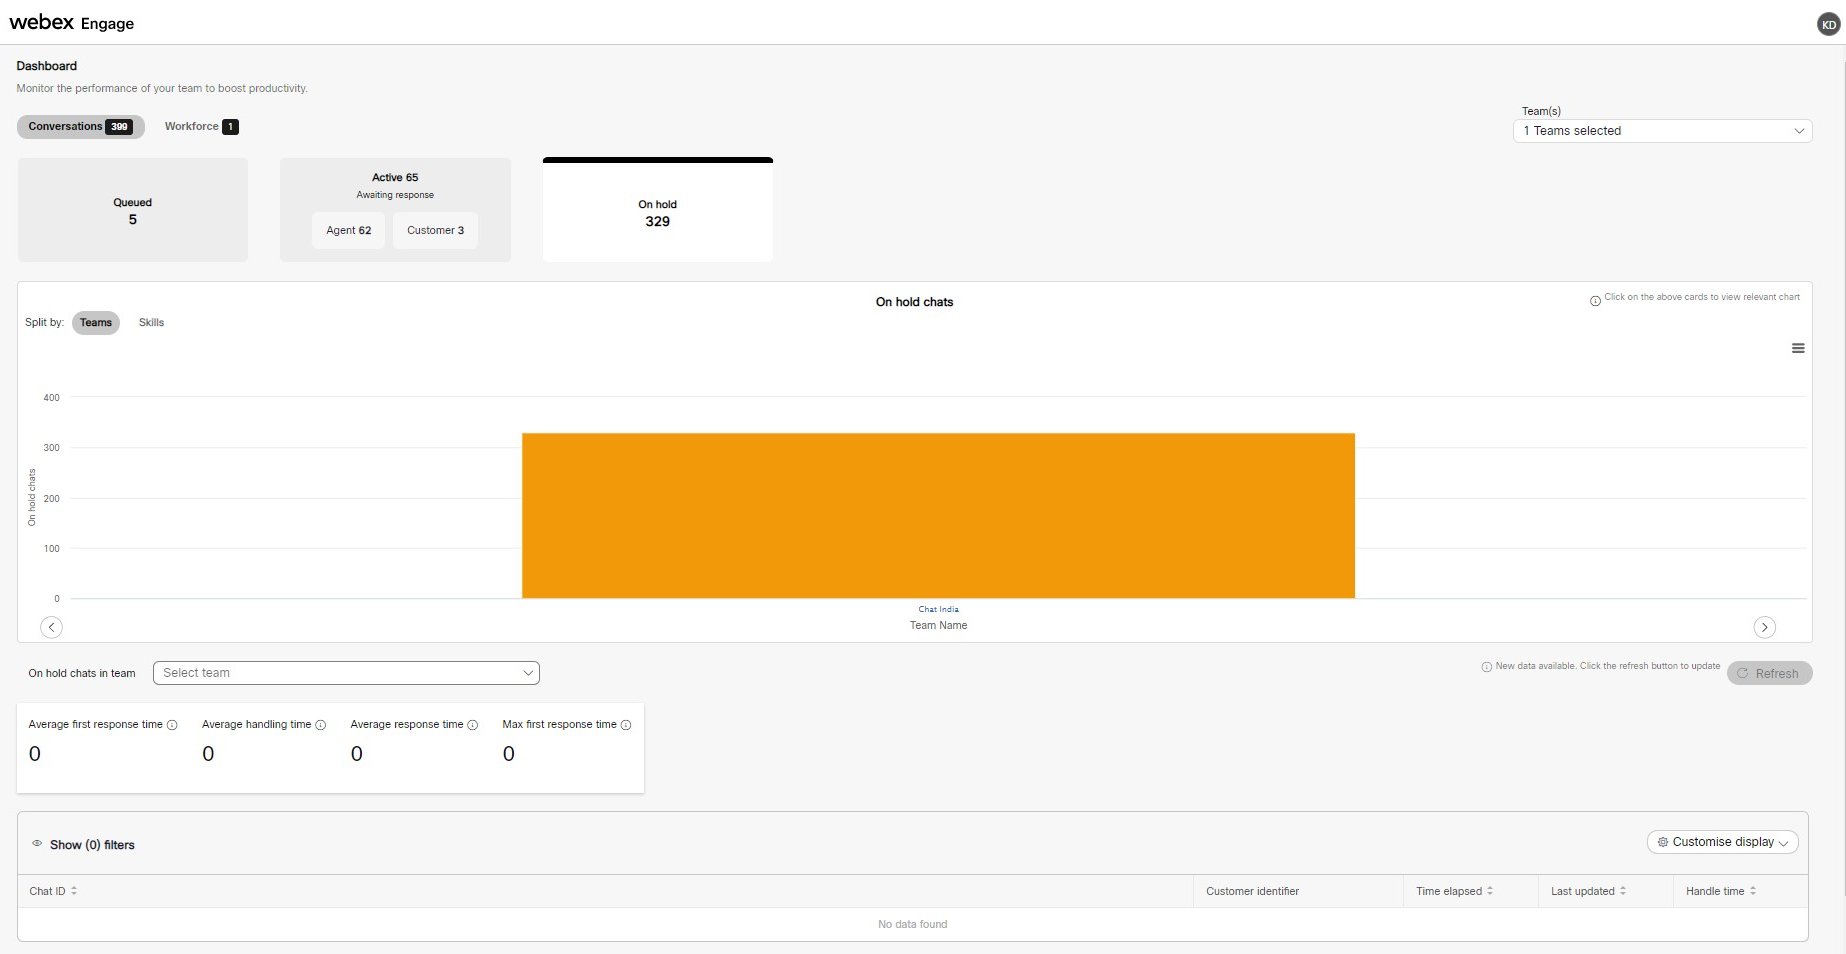
You can view the list of chats in Open status under the conversations tab. The open conversations are further classified into Queued, Active (awaiting a response from Agent or Customer), and On hold status. Each of the above metrics is a clickable card that, based on user selection, populates the chart (displaying Chat status vs. Time Comparison) and table on the Dashboard screen. The Queued conversations are represented in blue, Active conversations in green, and On-hold conversations in orange on the Chat status vs. Time comparison charts.
You can split the chats by Team and Skills as clickable chips in the chart. You can switch between views of the team chart – displaying Chat status vs. Time, comparing Teams and Count of chats, or the skill chart – showing Chat status vs. Time, comparing Skills and Count of chats.
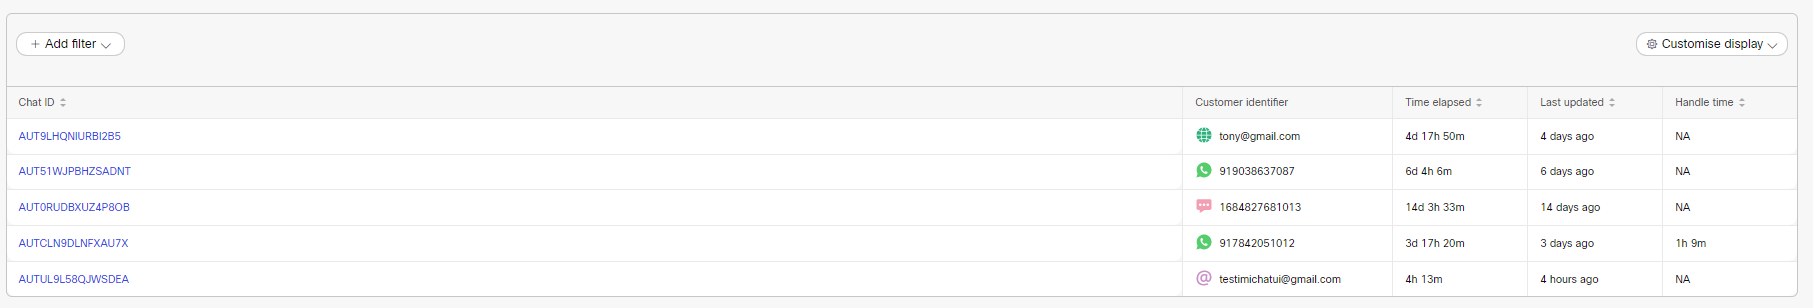
The table results display Chat ID, Customer ID, Message, Elapsed Time, First Response Time, Handled Time, Last Updated, and Assignee. The information is displayed in a tabular format with the ability to customize table display, filter, or sort data as desired.
To view the latest results, click the Refresh button on the bottom-right corner of the bar chat.
You can view the following metrics of the conversations in Queued, Active, and On-hold status by selecting a team from the drop-down below the bar chart:
- Average first response time
- Average handling time
- Average response time
- Max first response time
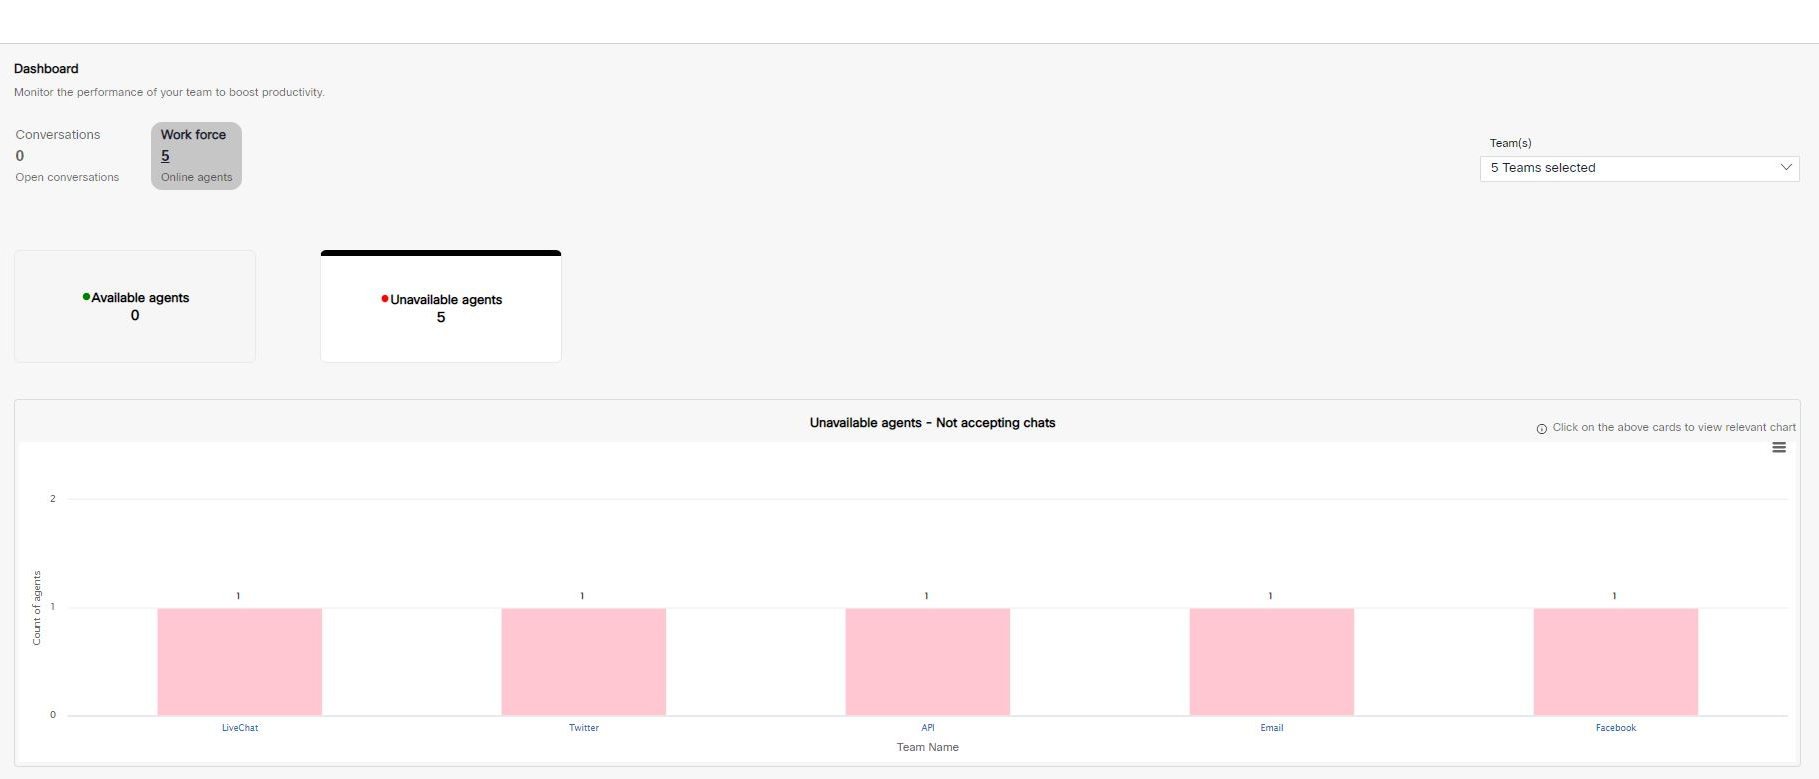
Workforce
The workforce provides a snapshot of the agent's work performance for the selected teams. On this screen, you can view the list of Available(accepting chats) and Unavailable Agents(not accepting chats). You can click the respective cards for detailed information about the agents in the specific team. The available agents are represented with a green dot, whereas the unavailable agents are with a red dot.
You can view Agent Name, Agent ID, Current Status, Time in Status, Chats Created, Chats Active, Chats Closed, Unique Customers Served, Total In Time, Avg. Response Time, Avg. First Response Time, Avg. Handling Time and Last Updated. The information is displayed in a tabular format with the ability to customize table display, filter, or sort data as desired.
To view the latest results, click the Refresh button on the bottom-right corner of the bar chat.
Sort table results
The Add filter feature helps to sort and view the User's table results with the help of AND and OR operands.
To sort table results, follow these steps:
- Click the Add filter button above the table results.
A Search drop-down appears, displaying all the column names in the list.
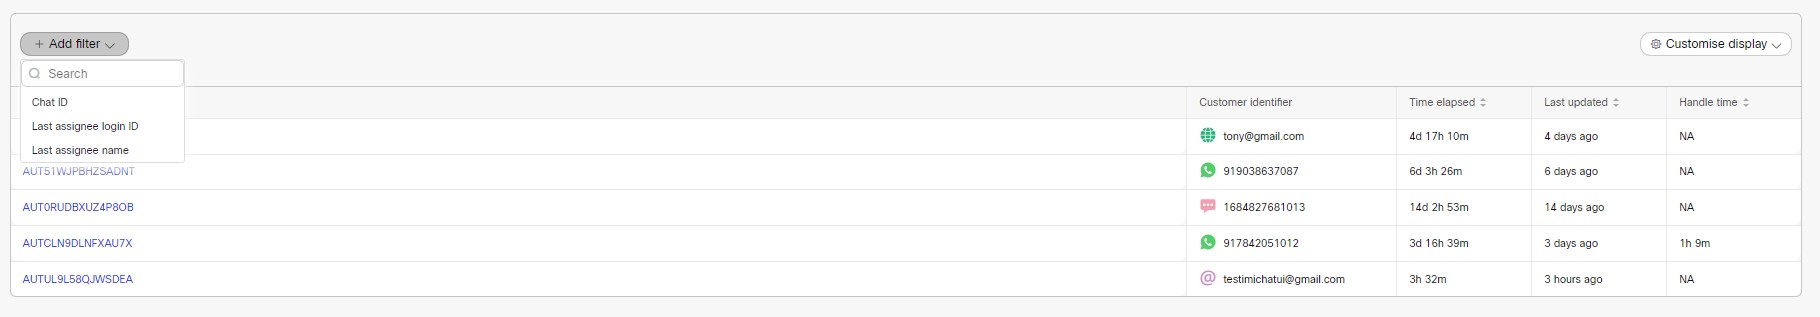
- Select a filter criterion and click Apply. The relevant results will appear on the screen.

- You can further sort the table results using the AND and OR operands.
- You can click the Hide filters button to view the search results on the screen.

- You can also click the Clear filters button to reset or clear the existing filters.
Customise Display of Table
The Customise Display helps you select a list of columns you want to preview in the table results.
To view customise table results, follow these steps:
- Click the Customise display drop-down on the top-right corner of the results table.
- Choose the required columns from the list by selecting the checkboxes adjacent to each column name.
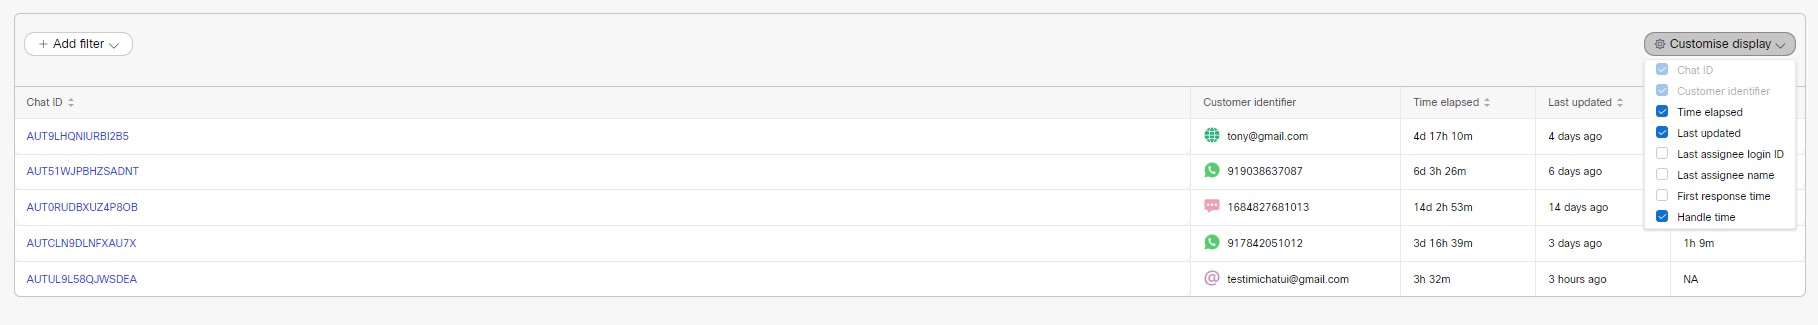
You can instantly view the results on the screen by checking and unchecking the checkboxes.
Updated over 2 years ago